Streaming data usage is easier to understand when you separate speed from allowance. Speed describes how quickly data can move at a moment. A data cap or monthly allowance describes how much data you can use before your internet provider applies warnings, fees, throttling, or plan limits. Streaming affects both, but in different ways.
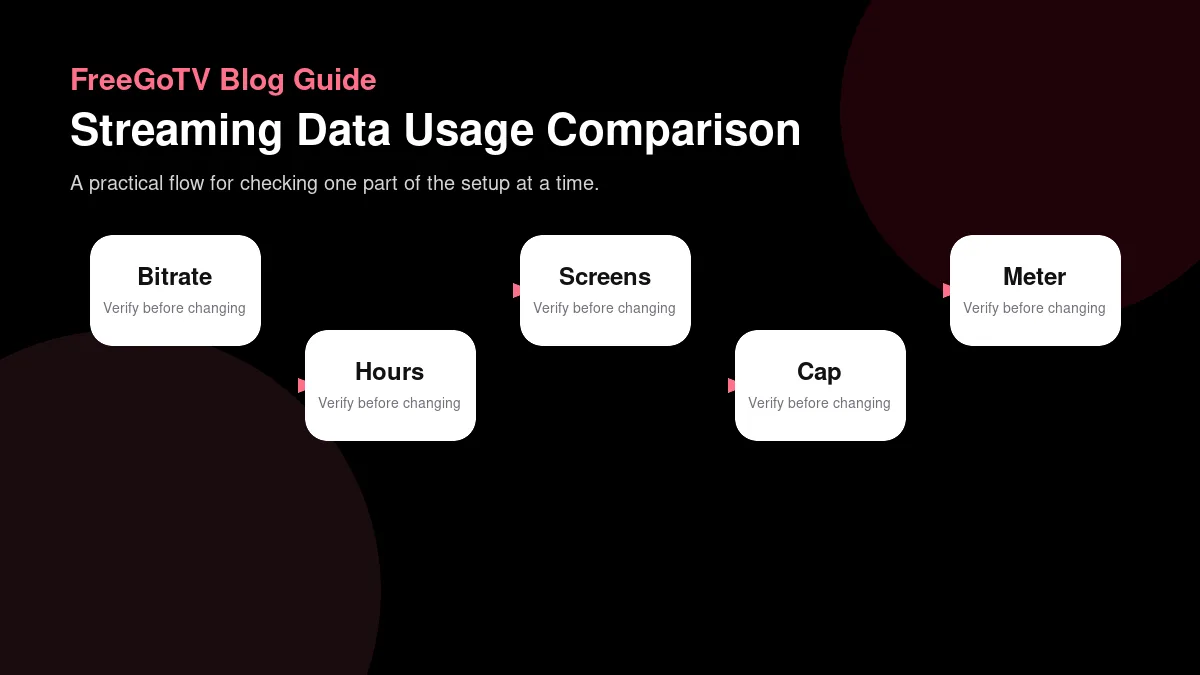
This guide shows how to estimate streaming GB per hour from bitrate and viewing time, then apply that estimate to multiple screens in a US household. It does not claim a fixed FreeGoTV data rate because actual usage depends on source, resolution, compression, player behavior, and viewing habits. For verified public pages, use FreeGoTV, pricing, and the FAQ.
Learn the basic units
Bits and bytes are different
Internet speed is usually advertised in bits per second, such as Mbps. Storage and usage allowances are usually described in bytes, such as GB. There are eight bits in one byte. That means a 10 Mbps stream does not use 10 megabytes every second; it uses about 1.25 megabytes per second before overhead and measurement differences.
GB and GiB are close but not identical
For practical household estimates, you can use a simple formula: Mbps multiplied by 0.45 gives approximate GB per hour. A 5 Mbps stream uses about 2.25 GB per hour. A 10 Mbps stream uses about 4.5 GB per hour. This is an estimate, not a promise, but it gives you a useful planning number.
GB and GiB are not identical. Many internet providers use decimal gigabytes, while operating systems may display binary gibibytes. The difference is small enough that household planning can usually use GB as a practical shorthand. If you are close to a strict cap, leave extra margin rather than arguing with unit conversions.
Remember that streaming apps may change bitrate during playback. Adaptive systems can use more data when the connection is strong and less when conditions worsen. A single average number is helpful for planning, but actual monthly use should be checked against your provider's meter.
Estimate GB per hour from bitrate
| Video quality | Example bitrate range | Approximate data per hour | Important caveat |
|---|---|---|---|
| SD or lower-bitrate mobile | 1-3 Mbps | About 0.45-1.35 GB per hour before overhead. | Small screens can still use more data if the app selects a higher adaptive stream. |
| HD 720p/1080p | 3-8 Mbps | About 1.35-3.6 GB per hour before overhead. | Sports and fast motion may need more bits than slower content at the same resolution. |
| Higher-quality HD or 4K-like streams | 8-20 Mbps | About 3.6-9 GB per hour before overhead. | The label alone does not prove actual resolution, bitrate, HDR, or codec efficiency. |
| Multiple screens | Multiply each active stream by viewing hours. | Two 5 Mbps streams for two hours is roughly 9 GB before overhead. | Simultaneous viewing matters more than the number of devices owned. |
| Provider meter result | Use your ISP or router meter when available. | It captures household reality better than a generic estimate. | Meters may include downloads, updates, games, cloud backups, and other traffic. |
Resolution does not equal bitrate
Resolution labels such as 720p, 1080p, and 4K are not data-usage guarantees. A well-compressed 1080p stream may use less data than a poorly compressed one. Fast motion, noise, frame rate, HDR, and codec choices all affect bitrate. Treat resolution as a clue, not a complete measurement.
Audio and overhead add a little more
Using the planning formula, a 3 Mbps stream is about 1.35 GB per hour, 6 Mbps is about 2.7 GB per hour, and 15 Mbps is about 6.75 GB per hour. Multiply by viewing hours and screens. Two screens at 6 Mbps for three hours use about 16.2 GB: 2.7 GB per hour times two screens times three hours.
Audio, subtitles, guide images, app artwork, and network overhead add some data beyond the video estimate. For normal planning, video dominates, but a household close to a cap should include a buffer. Round up instead of planning to the exact last gigabyte.
If you want to understand why two streams with the same resolution can use different amounts of data, read the streaming video quality guide. Bitrate, compression, and motion explain many surprises.
Model household scenarios
One screen is simple
Start with the normal week. Estimate hours per day for each active screen, then multiply by seven. A household that watches one 5 Mbps stream for two hours a night uses about 31.5 GB per week. That is 5 times 0.45 times two hours times seven days. Over a 30-day month, the same habit is about 135 GB.
Multiple screens multiply quickly
Now add simultaneous screens. If two rooms stream at similar quality for the same two hours, the monthly estimate doubles. If one screen watches lower-bitrate content while another watches high-motion sports, estimate them separately. The average household number is the sum of individual viewing patterns, not a single mysterious streaming total.
Do not forget non-television internet use. Game downloads, cloud backups, software updates, video calls, security cameras, and phones all count toward many provider caps. A streaming plan may look reasonable alone but exceed the allowance when combined with the rest of the household.
Connection limits and data caps are separate. A streaming subscription may allow a certain number of simultaneous connections while the internet provider imposes a monthly data allowance. Meeting one limit does not automatically satisfy the other. The evaluation guide explains how to confirm subscription terms before paying.
Measure real usage instead of guessing forever
Use the provider meter
Most US internet providers offer an account page or app that reports monthly usage. Check it before a trial, then again after several realistic viewing sessions. The difference gives a better estimate than any generic chart. Make sure you account for other household activity during the same period.
Compare device-level estimates cautiously
Some routers and devices report per-device usage. These reports can be helpful, but they may reset, group traffic oddly, or miss traffic routed through extenders. Treat them as directional unless you know how the router measures. Provider billing meters usually matter most for caps because they determine the official count.
Create one controlled test if you need a cleaner number. Note the provider meter, stream one device for a known period, avoid large downloads during the test, then check the meter later. Provider meters may not update instantly, so allow time. The result will still be approximate, but it will reflect your own setup.
If usage spikes unexpectedly, look beyond the streaming app. Automatic updates, cloud photo sync, game consoles, and backup software can consume large amounts of data while the television is off. Data planning works best when the whole network is visible.
Control data without ruining the experience
Lower quality only where it makes sense
Some apps and devices offer quality controls. Lowering quality can reduce data use, but it can also soften the picture or affect motion. Use it strategically. A small bedroom TV may look fine at a lower setting, while a large living-room screen may reveal compression quickly. Match the setting to the screen and content.
Schedule heavy background traffic
Router or device controls can help schedule updates outside viewing hours. Game consoles and computers often download large updates automatically. Moving those downloads to overnight or a cap-friendly period can protect both data allowance and streaming stability.
If your internet plan includes a strict cap, set household expectations. Decide how many hours of high-quality streaming fit the month, which screens can use lower settings, and when to pause nonessential downloads. A shared plan works better when everyone knows the tradeoff.
Do not use unknown compression apps, VPNs, or modified players solely to save data without understanding their privacy and reliability implications. A data-saving promise from an untrusted tool can create security or support problems larger than the cap itself.
Plan for events, travel, and mobile hotspots
Live events concentrate usage
Big live events can create unusual usage patterns because several people may watch longer than normal, use second-screen apps, or stream pregame and postgame coverage. Estimate the whole event window, not just the advertised start time. If guests bring devices, household Wi-Fi demand can rise quickly.
Mobile data is different
Mobile hotspots and fixed home internet plans often have different limits. A stream that feels ordinary on home broadband can consume a large share of a mobile hotspot allowance. Check the mobile plan's high-speed data rules, hotspot restrictions, and throttling behavior before relying on it for television.
Travel adds another concern: account terms. Some services limit locations, devices, or simultaneous sessions. Data availability does not mean subscription permission. Review terms before planning a trip around streaming access.
For temporary situations, download legitimate offline content when a service offers it, use hotel or venue Wi-Fi only when safe and permitted, and avoid entering credentials on shared or unknown devices. Data planning and account safety should move together.
Create a monthly data budget
Start with the cap and subtract fixed usage
If your provider sets a monthly allowance, start with that number and subtract non-streaming usage you cannot easily avoid. Work video calls, cloud backups, school devices, security cameras, and software updates may consume a baseline amount. The remaining data is the realistic entertainment budget, not the entire cap printed on the bill.
Use conservative estimates for shared households. If several people stream unpredictably, plan with a margin. A budget that works only when everyone behaves perfectly will fail in ordinary life. Data planning should reduce arguments, not create a household accounting project.
Track patterns, not every minute
You do not need to log every show forever. Track a normal week, a heavy week, and any special event period. Those patterns are enough to predict whether the plan is comfortable, close, or inadequate. After that, check the provider meter a few times during the month.
When usage is close to the cap, decide in advance what changes first: lower quality on secondary screens, pause large downloads, shift updates overnight, or upgrade the internet plan. A pre-agreed rule is easier than reacting after a warning email arrives.
Understand unlimited plan language
Some plans advertise unlimited data but still include network-management policies, hotspot limits, or fair-use language. Read the actual internet provider terms. Unlimited home broadband and unlimited mobile hotspot service often behave very differently. The label alone does not answer streaming reliability questions.
If a plan slows traffic after a threshold, streaming may continue at lower quality or buffer more often. That is a data-policy issue rather than an IPTV app setting. Check the provider account page before changing streaming credentials or reinstalling apps.
Keep billing-cycle dates in mind. Heavy usage on the last day of the cycle has different consequences from heavy usage during the first week. Many provider apps show both used data and days remaining; use both numbers for decisions.
Monthly data planning worksheet
Record hours and screens before estimating usage
Use a short worksheet before making changes or contacting support. For data planning, write the device, app name, app version, network path, time of day, and the exact result you observed. Then add what you expected to happen and why. This turns a vague impression into evidence that another person can understand without standing in your living room.
For data planning, start with viewing behavior rather than app behavior. Write the number of screens, typical hours per day, common resolution, and whether viewing happens on home broadband, mobile hotspot, or a capped connection. This creates a household estimate before you look at provider meters, so the meter can confirm or correct a real assumption.
Use separate rows for ordinary days and heavy days. A household may stream lightly during the week and heavily during sports, school breaks, or guest visits. Averaging those patterns together can hide the real risk. Planning for a peak weekend is more useful than pretending every day has the same number of screens.
Compare estimates with the internet provider's usage meter at the same point in each billing cycle. If the worksheet predicts modest use but the meter climbs quickly, look for background downloads, cloud backups, game updates, or other streaming apps before blaming one television session. Data planning works best when the whole household is counted.
Keep provider-meter notes private
Data notes rarely need private account details. Record plan allowance, current usage total, billing-cycle date, device count, and quality settings, but do not share provider login pages or billing screenshots with unrelated support contacts. If a screenshot is necessary, crop names, addresses, account numbers, payment details, and other private fields.
When discussing data use with a streaming or internet provider, ask about the measurement they can actually verify. A streaming support team may help with quality settings or adaptive behavior, while an internet provider can explain the meter, cap, throttling rules, or billing cycle. Sending the right question to the right party avoids circular troubleshooting.
After a month of real use, replace estimates with observed ranges. Keep the quality setting, typical hours, number of screens, and final usage total. That record is more reliable than a generic GB-per-hour table because it reflects your devices, habits, and provider meter. Revisit it whenever the household adds a screen or changes plans.
Finally, connect this worksheet to the rest of your streaming decision. Usage notes should show estimated bitrate, hours, screens, provider-meter readings, cap threshold, and planned controls for heavy months. If you need broader context, use the video-quality and buffering guides. The best streaming setup is not the one with the most undocumented tweaks; it is the one whose requirements, limits, and recovery steps are understood by the people who use it.
Compare estimates with the provider meter
For data planning, review usage after any major habit change: a new television, a sports season, school breaks, guests, a new game console, or a switch from mobile viewing to living-room viewing. The old estimate may no longer describe the household. Recalculate with current hours and current screens, then compare with the provider meter midway through the billing cycle. If the household is already above half the allowance before half the month is over, decide early whether to lower quality, pause downloads, or change plans. Early action is cheaper and calmer than reacting after throttling begins.
Check background traffic before blaming streaming
Also remember that provider meters can lag. A usage page may update hourly, daily, or after a session closes. If you run a controlled test and the number does not change immediately, wait for the provider's normal reporting delay before concluding that the stream used no data. For cap planning, delayed reporting means you should keep a margin near the end of the billing cycle. Do not plan to use the final few gigabytes precisely when the official count may arrive after the viewing already happened.
Reconcile estimates with real meter data
A bitrate estimate is a planning tool, not a bill. Your internet provider meter may include app updates, game downloads, cloud backups, phone syncing, smart-home devices, and other household traffic. If the meter is higher than expected, compare a day with heavy streaming against a day with little streaming before blaming one app. Router-level usage reports can help, but they also vary by model and may classify traffic differently.
For the most practical monthly plan, write down the number of active screens, average viewing hours, and the type of content watched most often. Live sports, long events, and high-motion channels can behave differently from casual background viewing. If a cap is tight, test a representative week and leave room for non-streaming traffic instead of planning to the exact last gigabyte.
FAQ
How many GB does streaming use per hour?
How many GB does streaming use per hour? Multiply Mbps by about 0.45. A 5 Mbps stream is roughly 2.25 GB per hour, while a 15 Mbps stream is roughly 6.75 GB per hour. Actual usage varies by codec, content, app, and adaptive bitrate.
Does 4K always use the most data?
Does 4K always use the most data? Usually 4K uses more than lower resolutions, but bitrate is the real driver. A heavily compressed 4K stream may use less data than another high-quality 1080p stream. Resolution alone is not enough.
Can buffering mean I am out of data?
Can buffering mean I am out of data? Sometimes a provider may throttle after a cap, but buffering can also come from Wi-Fi, congestion, app issues, or source problems. Check your internet account meter and use structured troubleshooting before assuming the cap is the cause.
Conclusion: plan from bitrate, hours and real meter data
Use estimates, then verify
Streaming data usage is not mysterious once you convert bitrate into hourly consumption and multiply by real viewing habits. The estimate gives you a starting budget. Your provider meter tells you what actually happened. Together they help you choose quality settings, schedule downloads, and avoid cap surprises.
Your next step is to estimate one week of normal viewing, compare it with your internet allowance, and then verify with your provider's meter. Keep FreeGoTV available for public plan navigation and use the buffering guide if data use and playback stability become connected questions.